
Comptroller Kevin Lembo Archive > News
COMPTROLLER LEMBO PROJECTS $93.9-MILLION DEFICIT UNDER EXECUTIVE ORDERFUTURE REPORTS TO REFLECT UPDATED PROVISIONS OF NEW BIENNIAL BUDGET
Comptroller Kevin Lembo today said that (based on revenue and spending through Sept. 30) the state remained on track to end the current fiscal year with a $93.9-million deficit under the provisions of the Governor’s Executive Order Resource Allocation Plan.
The new biennial budget, signed just yesterday - as well as updated consensus revenue projections expected later this month - will have a significant impact on this outlook in future months.
In a letter to Gov. Dannel P. Malloy, Lembo said that Connecticut - dogged by persistent revenue uncertainty and three consecutive months of job loss - continues to lag the nation in economic performance.
In particular, Lembo said areas that warrant close watch include underperformance in both the sales tax and the estimated payments portion of the personal income tax.
“Even as the national economy exhibits increasing signs of strength, Connecticut’s economy continues to post mixed results across an array of key economic indicators,” Lembo said.
“Despite Connecticut’s historical budget relationship with the stock market, shifts in equity portfolio allocations following the presidential election and a run-up in equity values has not delivered capital gains revenue increases to the state. The estimated and final payments portion of the personal income tax accounts for about 35 to 40 percent of total state income tax receipts, and yet first-quarter estimated payment receipts came in 5.1 percent lower this year.
“In anticipation of federal tax reform - and the potential for lower tax rates on capital gains for some of Connecticut’s wealthiest earners – investors may be delaying large gains in the current environment. Investors are also increasingly using tax-efficient vehicles such as Exchange Traded Funds (ETFs) that don’t generate as large a number of taxable gains transactions.” Lembo said these factors will demand close monitoring as the state implements the provisions of the new biennial budget.
In the meantime, Lembo pointed to the latest economic indicators from federal
and state Departments of Labor and other sources that show:

• Based on FY 2017 final results, the withholding portion of the income tax
increased only 1.3 percent compared with the prior fiscal year.
• In the first three months of the new fiscal year, withholding receipts were up
7.5 percent from last year. However, this growth is somewhat overstated due to
revenue accruals related to FY 2017 year-end. Adjusting for this accrual
activity, the FY 2018 year-to-date growth in withholding collections is to
closer to 2.3 percent.

• Preliminary state Department of Labor (DOL) data for October 2017 show that Connecticut lost 2,000 net jobs during the month of September to a level of 1,684,900 seasonally adjusted. August’s original preliminary job loss of 3,900 was revised down by the Bureau of Labor Statistics (BLS) to a loss of 4,200. Since the end of June, the state experienced a total of 7,900 job losses and over the past twelve month period ending in September, the state has posted only 3,500 new payroll jobs. During the last period of economic recovery, employment growth averaged over 16,000 annually.

• Connecticut has now recovered 76.2 percent (90,700 payroll job additions)
of the 119,100 seasonally adjusted jobs lost in the Great Recession (3/08-2/10).
The job recovery is into its 91st month and the state needs an additional 28,400
jobs to reach an overall employment expansion.
• Connecticut's unemployment rate for September fell by two-tenths of a point
from last month and now stands at 4.6 percent. The decrease in the unemployment
rate was in part due to a decline in the size of the state’s labor force.
Nationally, the unemployment rate was 4.2 percent in September.

• DOL reports that September 2017 seasonally adjusted average weekly initial
unemployment claims for first-time filers in Connecticut increased by 331
claimants (9.1 percent) to 3,956 from August 2017, but were lower by 101 claims
(-2.5 percent) from the September 2016 level of 4,057.
• An equal number of the major job sectors experienced gains and losses in
September 2017 versus the September 2016 levels. Five sectors had job gains from
a year ago, while five experienced job losses.

• Connecticut’s employment and revenue numbers must be viewed in the light of
its declining population. The U.S. Census reported that Connecticut saw a
decline in population of 8,278 residents between July 1, 2015 and July 1, 2016.
Connecticut was one of only eight states to experience a decline in population
during this period. Connecticut has now posted three consecutive years of
population decline.
• According to a May 2017 report by CT Data Collaborative, the largest driver of
Connecticut’s declining population was an increase in the number of people
leaving Connecticut for other states. This net migration to other states
increased 55 percent (or about 9,200 individuals) over the period from 2013 thru
2016 compared to the mid 2000’s.
• International migration has helped to mitigate Connecticut’s overall
population loss, as there has been about a 30 percent increase (or about 3,700
people) in the average number of net migrants per year post-recession compared
to pre-recession.
• Based on the Internal Revenue Service tax return data, more households move in
to Connecticut from New York and New Jersey than leave Connecticut for those
states. On the other hand, more people leave Connecticut for Massachusetts and
Florida than move in from those states.
• Our neighboring states of Massachusetts, New York, and Rhode Island are
experiencing substantially more growth in total tax returns filed compared to
Connecticut.
• Connecticut is losing on net a higher number of 22-29 year olds and those aged
65 or older compared to pre-recession. Conversely, post-recession Connecticut is
gaining on net a higher number of domestic in-migrants aged 30-64 years,
especially those aged 30 to 49.
![]()
• Average hourly earnings at $30.92, not seasonally adjusted, were up $0.54,
or 1.8%, from the September 2016 estimate. The resultant average Private Sector
weekly pay amounted to $1,045.10, up $15.22, or 1.5% higher than a year ago.
• The 12-month percent change in the Consumer Price Index for All Urban
Consumers (CPI-U, U.S. City Average, not seasonally adjusted) in September 2017
was 2.2%.
• The Bureau of Economic Analysis reported that Connecticut’s personal income
grew by 3% between 2015 and 2016. This ranked Connecticut 33rd nationally in
2016 income growth.
• A September 26th report from the Bureau showed Connecticut personal income
increasing at a quarterly rate of 0.8% between the first and the second quarter
of 2017. On an annualized basis this growth would be 3.1%. This ranked
Connecticut 22nd nationally in personal income growth and slightly above the
national average. BEA will release data on state personal income for third
quarter 2017 on Dec. 20.


• According to an October 20th report from CT Realtors, the sale of
single-family residential homes in Connecticut decreased by 7.0% in September
2017 from the same month a year earlier. The total units of homes sold were
3,095 in September 2017 versus 3,328 in September 2016. The median sales price
of a home decreased 1.6% to $249,950 from $254,000. The sale of townhouses and
condominiums in the state posted a sales decrease of 6.0 percent, comparing
September 2017 to September 2016. The median price was up 3.0% to $170,000.
• Nationally, total home sales (includes single-family homes, townhouses and
condominiums) in September 2017 increased 1.5% from September of last year
according to the National Association of Realtors. The national median price of
a home in was $245,100. In the Northeast Region of the United States, home sales
decreased 1.4 percent for the same time period, with a median sales price of
$274,100.
Consumers
• Consumer spending is the main engine of the U.S. economy, accounting for more
than two-thirds of total economic output. The Commerce Department reported that
advance retail sales increased by 1.6 percent in September 2017 from the
previous month, the largest monthly increase since March 2015. On an annual
basis, retail sales grew by 4.4 percent compared with September 2016.
• Analysts largely attributed September’s growth to reconstruction and clean-up
efforts related to the devastation caused by Hurricanes Harvey and Irma. Sales
at gardening and building material stores increased 2.1 percent last month and
receipts at auto dealerships grew 3.6 percent, as consumers replaced
flood-damaged motor vehicles. Sales at gasoline stations surged 5.8 percent,
reflecting higher fuel prices after Harvey disrupted production at oil
refineries in the Gulf Coast region.
• In other categories, sales at electronics and appliance stores fell 1.1
percent in September, while receipts at clothing stores rose 0.4 percent. Sales
at online retailers climbed 0.5 percent. Receipts at restaurants and bars jumped
0.8 percent and sales at sporting goods and hobby stores fell 0.2 percent.
Consumer Debt and Savings Rates
• According to the Federal Reserve Bank of New York, aggregate household debt
balances rose to a new peak in the second quarter of 2017. As of June 30, 2017,
overall debt – including mortgages, auto loans and student loans – hit a record
$12.84 trillion. This increase put overall household debt $164 billion above its
peak in the third quarter of 2008, and 15.1 percent above its trough in the
second quarter of 2013. Aggregate household debt balances have now increased in
12 consecutive quarters.
• The New York Federal Reserve also noted that mortgage balances, the largest
component of household debt, increased again during the first quarter. Mortgage
balances shown on consumer credit reports on June 30 stood at $8.69 trillion, an
increase of $64 billion from the first quarter of 2017. Balances on home equity
lines of credit were roughly flat, and now stand at $452 billion. Non-housing
balances were up in the second quarter. Auto loans grew by $23 billion and
credit card balances increased by $20 billion, while student loan balances were
roughly flat.

• Americans have also dramatically reduced their savings over the past year.
The personal-saving rate fell to 3.8% in June, down from a recent peak of 6.3%
in October 2015 and not far off from prerecession lows.
• The higher debt levels and lower savings point to U.S. wage gains that aren't
keeping up with consumers' needs and desires to spend. This also signals a more
uncertain outlook for future consumer spending gains.
• The graph below provides a long-term view of the U.S. savings rate from the
beginning of 1969 through June of 2017. As can be seen there is a pronounced
downward trend over the period. It should be noted that the U.S. Personal Saving
Rate does not include capital gains from the sale of land or financial assets in
its estimate of personal income. This effectively excludes capital gains – an
important source of income for some.

• The U.S. consumer confidence index (CCI), published by the Conference
Board, is an indicator designed to measure consumer confidence. This is defined
as the degree of optimism on the state of the economy that consumers are
expressing through their activities of savings and spending.
• The Conference Board reported that consumers' assessment of current economic
conditions improved significantly in October 2017. The Index now stands at
125.9, up from 120.6 in September. Consumer confidence increased to its highest
level in almost 17 years, which the Conference Board attributed to the strength
of the U.S. job market.
Business and Economic Growth
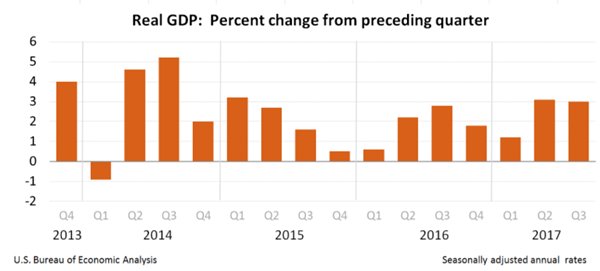
• Gross Domestic Product increased at an annual rate of 3 percent in the third quarter of 2017 based on BEA’s advance estimate. The economy continued to show resilience despite concerns that the major hurricanes in August and September would dampen economic output. In the second quarter, real GDP increased 3.1 percent.
• BEA reported that the increase in real GDP in the third quarter reflected
positive contributions from person consumption expenditures (PCE), private
inventory investment, nonresidential fixed investment, exports, and Federal
government spending. These increases were partially offset by negative
contributions from residential fixed investment and state and local government
spending.
• The following graph by the Federal Reserve Bank of St. Louis shows changes in
the various components of GDP over time through July 1, 2017. As noted earlier,
consumer spending is by far the largest single component of GDP.

• According to an Oct. 25 report by the U.S. Department of Commerce, new
orders for manufactured durable goods increased in September by $5.1 billion or
2.2 percent to $238.7 billion. This increase, up three of the last four months,
followed a 2.0 percent increase in August. Excluding transportation, new orders
increased 0.7 percent. Excluding defense, new orders increased 2.0 percent.
Transportation equipment, also up three of the last four months, led the
increase, $4.0 billion or 5.1 percent to $81.2 billion.

The Markit Flash Purchasing Manager’s Index (PMI) for Oct. 24 reported the following:

CBIA: 2017 Hartford, New Haven, Springfield Business Survey
On Oct. 18, the Connecticut Business and Industry Association (CBIA) released its 2017 Hartford, New Haven, Springfield Business Survey, which was conducted in partnership with the New England Knowledge Corridor. The 2017 survey represented the views of more than 400 executives from companies across the region. Respondents were asked about their priorities and challenges for issues such as workforce development, transportation, international trade and business costs. Half the companies that participated in the survey have locations in Connecticut, 44 percent are in Massachusetts and 6 percent have operations in both states.
Key findings include:
• The percentage of regional businesses reporting net profits is the highest
since the recession hit in 2008.
• Quality of life remains the greatest benefit for managing a business in the
region.
• Economic forecasts vary significantly by company outlook, the region, and the
U.S., and for the short- and long-term.
• High taxes again represent the greatest barrier to growth, followed by
economic uncertainty.
• The percentage of companies that consider the region’s pool of skilled workers
an asset declined, while the percentage that sees the skills gap as a barrier to
growth rose.
• Traffic congestion and an aging infrastructure are the most pressing
transportation issues for the region.
Survey respondents had differing views of their confidence in the national
and regional economies. Short-term confidence in the U.S. economy was relatively
strong, with 42 percent expecting improved national conditions next year, while
a third (33 percent) have a stable outlook and a quarter (25 percent) forecast a
downturn.
CBIA noted this contrasted sharply with survey respondents’ short-term outlook
for the region. Less than a third (29 percent) believe the region’s economy will
improve next year, with 38 percent forecasting stability and a third (33
percent) expecting worsening conditions.

The full report is available from CBIA at the following link:
https://www.cbia.com/wp-content/uploads/2017/10/NEKC_17.pdf
Stock Market
• Estimated and final income tax payments account for approximately 35 to 40
percent of total state income tax receipts. Both the estimated and final
payments had a negative rate of growth in both Fiscal Years 2016 and 2017.
• The bulk of the estimated and final payment receipts for Fiscal Year 2018 will
be collected between September and the end of the Fiscal Year.
• Therefore, September 2017 represented the first significant collection period
for quarterly estimated tax filings and the initial results are not encouraging.
Compared with the prior fiscal year, FY 2018 first quarter estimated payment
receipts came in 5.1 percent lower.

• Shifts in equity portfolio allocations following the presidential election and
a run-up in equity values have not resulted in capital gains related revenue
increases for the state.
• The potential for lower federal capital gains tax rates has remained unclear
since the presidential election and investors may have been unwilling to take
large gains in this environment of uncertainty. In addition, investors are
increasingly using tax efficient vehicles such as Exchange Traded Funds (ETFs)
that don’t generate as a large a number of taxable gains transactions. Assets in
these investments rose from $450 billion in 2008 to almost $2.8 trillion today.
• Both the Dow Jones Industrial Average and the Nasdaq Composite Index are
showing significant year-to-date gains in calendar 2017.


***END***