
Comptroller Kevin Lembo Archive > News
COMPTROLLER LEMBO PROJECTS $279.4-MILLION DEFICIT FOR FISCAL YEAR 2016Comptroller Kevin Lembo today reported a projected General Fund deficit of $279.4 million for Fiscal Year 2016, an improvement of $36.4 million.
In September, Lembo will begin reporting early projections for Fiscal Year 2017. The final unaudited Fiscal Year 2016 numbers will be available on September 30, with a final audited report released before the end of the calendar year.
In his letter to Gov. Dannel P. Malloy, Lembo cited one-time revenue from federal grants as the primary impetus for improvement, but expressed concern over the continued volatility of income tax receipts.
“Connecticut continues to recover at a slow pace,” Lembo said. “Market volatility, and lower than anticipated wage growth, have led to significant shortfalls in income tax receipts and negated progress made in other areas of the economy.”
Income tax revenue is $659.4 million short of the original nonpartisan consensus revenue projections. The state’s Budget Reserve Fund currently holds a balance of $406 million.
Lembo warned that further erosion is possible. “Our reserves are currently sufficient to cover the projected deficit, but there is little room for error,” he said. “I will be watching revenue accruals closely over the coming months, and Medicaid expenditures through August.”
Erratic reports on job and wage growth – both locally and nationally – have complicated the forecasting process, Lembo said.
“Having dependable data leads to more reliable projections and, in turn, better policy decisions,” said Lembo. “I am concerned about the veracity of the job numbers in particular, as they have been significantly and continuously adjusted in recent months.”
Lembo pointed to some of the latest economic indicators from federal and state Departments of Labor and other sources that show:

• Through June, year-to-date income tax withholding receipts were running
4.4% percent above the same period last fiscal year. Fiscal Year 2016
withholding receipt data will be finalized the second week in August 2016 after
accruals are posted. New tax rate tables incorporating the higher rate structure
as adopted in PA 15-244 were required to be implemented by the end of August
2015. Therefore, beginning in September 2015 receipts have incorporated the
higher tax rates.
• Payroll driven withholding receipts are the largest single source of state tax revenue accounting for 61% of the total income tax receipts in Fiscal Year 2015 and almost 40% of total General Fund tax receipts in that year. With the exception of tax increase spikes in Fiscal Years 2011 and 2012, the current cycle of economic recovery has posted below normal withholding gains.

• The Department of Labor reported that the state gained 7,900 jobs in June 2016, which brought payroll employment to a level of 1,693,400. The May employment figure was revised down to post a job loss for the month of 4,000 positions.
• The large employment swings in May and June mirror the pattern observed in the national data. It appears that the variance may be due to seasonal adjustment factors rather than real employment changes of those magnitudes.
• Looking at the past twelve month period ending in June, the state has added 17,900 jobs. This is consistent with a period of moderate economic expansion. At this rate of job additions, it will take more than a year for Connecticut to fully recover its recessionary job loss.
• Connecticut has now recovered 99,200 positions, or 83.3% of the 119,100 seasonally adjusted total nonfarm jobs that were lost in the state during the March 2008 - February 2010 employment recession.
• The state needs to reach the 1,713,300 seasonally adjusted job mark to enter a clear nonfarm employment expansion.

As the state’s employment recovery has progressed over the past year, an increasing number of job sectors have posted sustained employment gains.

• U.S. employment has been advancing at a rate of 1.7% over the twelve-month period ending in June; Connecticut’s employment growth was 1.1% for the same period.
• Connecticut’s unemployment rate was 5.8% in June; the national unemployment rate was 4.9%. Connecticut’s unemployment rate has continued to decline from a high of 9.5% in October 2010.
• There were 110,600 unemployed job seekers in Connecticut in June. A low of 36,500 unemployed workers was recorded in October of 2000. The number of unemployed workers hit a recessionary high of 177,200 in December of 2010.
![]()
• Average hourly earnings at $29.93, not seasonally adjusted, were up $1.18, or
4.1%, from the June 2015 hourly earnings estimate ($28.75). The resulting
average Private Sector weekly pay was calculated at $1,005.65, up $48.27, or
5.0% higher than a year ago. Note: Other data sources do not support this
aggressive level of wage growth. In the 2nd quarter of 2016, U.S. wage growth
was advancing at a 2.9% rate from a year ago.
• The 12-month percent change in the Consumer Price Index for All Urban Consumers (CPI-U, U.S. City Average, not seasonally adjusted) in June 2016 was an even 1.0%.
• Connecticut ranked 36th nationally in income growth for the 1st quarter of 2016 based on personal income statistics released by the Bureau of Economic Analysis on June 22nd . The state’s personal income was growing at an annualized 3.1% rate in the 1st quarter of the year. This is the same growth level recorded in 2015.

• Personal income statistics for 2nd quarter personal income growth will be released on September 28th.

• According to a June 30th release by the Warren Group, single family home sales
in Connecticut grew by 23.9% in May from the same month last year. That exceeds
the strong April sales numbers. Connecticut recorded 2,921 single-family home
sales in May 2016, the most sales in the month of May since 2007.
• Condominium sales also grew at a double digit rate, up growing 14.7% from May of last year with 719 new purchases.
• Single-family home prices in Connecticut were soft. The sales price dropped by 7.2% in May to $246,000 compared to $265,000 a year ago. This followed a small price gain in April.
• Condominium prices rose by 5.8% in May from $162,500 to $172,000.
• According to Berkshire Hathaway HomeServices 2nd quarter report, inventory for single family homes in Connecticut was 9.6 months for the 2nd quarter of 2016, up from 8.4 months in the 1st quarter of 2016. Inventory for condominiums was 8.7 months, up slightly from 8.3 months in 1st quarter of 2016. This number tells you how many months it would take for all the current homes on the market to sell, given the monthly sales volume. Four to five months of supply is average. As the number rises it indicates that there are more sellers than buyers, or a buyer’s market.

• Nationally, home prices continued to rise quickly in May, continuing a pattern of growth that is at its strongest level since the 2007 housing peak. The S&P/Case-Shiller Home Price Index grew by 5% in the 12 months ended in May, identical to the index’s increase in April. Home prices are just 2% below the peak hit in 2007, while commercial property values have hit records.
• However, price growth in some of the country’s largest cities slowed, which is consistent with other indications that the market is cooling slightly. The group’s 10-city index gained 4.4% from a year earlier, down from 4.7% the prior month, and the 20-city index rose 5.2% year over year, below the 5.4% rise in April.
Consumers
• Sales at U.S. retailers rose more than forecast in June in a broad advance that shows consumers continued to fuel growth in the 2nd quarter of 2016. A July 15th report from the Commerce Department on June sales showed a 0.6% increase in retail receipts for the month.
• Eleven of 13 major categories showed stronger demand in June from the prior month, including a 1.1 % advance in receipts at online merchants and a 0.7 % increase at health and personal care outlets.
• Retail sales in the first half of 2016 performed at a solid pace, growing close to 4% on a year-over-year basis, according to National Retail Federation’s calculations, which exclude automobiles, gasoline stations and restaurants.
• The increases in consumer spending during the first half of 2016 is expected to remain solid during the remainder of the year. The National Retail Federation increased 2016 retail sales projections by 30 basis points to 3.4% over last year.
• Retail sales aren't the only determinant of overall consumer spending in the U.S. The Commerce Department’s Quarterly Estimates for Selected Service Industries documents consumer spending on utilities, transportation, education, administrative support and professional services, among other expenditures that aren't captured in the retail sales report. The 1st quarter of 2016 posted a total revenue gain of 3.6% over the same quarter last year. The quarter-to-quarter change was down slightly, but the longer-term trend has shown quarterly gains for the past several years. Second quarter results will be released on September 8th.

• U.S. consumer confidence was relatively unchanged in July according to the
Conference Board’s index. This is another indicator that consumer spending could
continue to support the U.S. economy over the second half of the year. Consumers
remain cautiously optimistic about growth in the near-term. Sentiment about the
labor market was mixed. The share of respondents saying jobs were “plentiful”
fell slightly to 23%, but outweighed the share who said jobs were “hard to get,”
which edged down to 22.3%. Hiring has slowed in 2016 to an average of 172,000
jobs a month, compared with a monthly average of 229,000 jobs in 2015.
• The Federal Reserve’s report on consumer borrowing showed consumer credit
increased at a seasonally adjusted annual rate of 6.25% in May. Revolving credit
increased at an annual rate of 3%, while non-revolving credit increased at an
annual rate of 7.25%. The graph below shows the percent change in consumer
credit since 2008.

Business and Economic Growth
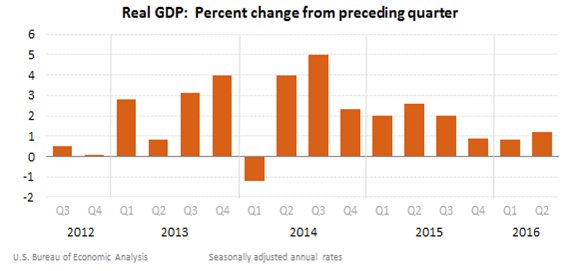
• According to the July 29th advance estimate by the Bureau of Economic Analysis, GDP in the 2nd quarter of 2016 grew at a 1.2% annual rate. The figure was well below the 2.6% growth economists surveyed by The Wall Street Journal had forecast. In the 1st quarter GDP grew by 0.8%.
• To date in 2016, the economy is growing at about a 1% annualized rate, the worst first-half performance since 2011.
• In the 2nd quarter, consumer spending rose strongly. Personal consumption, which accounts for more than two-thirds of economic output, expanded at a 4.2% rate, the best gain since late 2014. However, much of that gain was eroded by nonresidential fixed investment-- business spending-- that declined at a 2.2% pace. This was the third straight quarterly drop. Companies spent less on buildings and equipment.
• Firms also cut back on inventories sharply. The change in private inventories subtracted 1.16% from GDP. That was the category’s fifth-straight decline and the largest drag from inventories in two years.
• Corporate profits were positive in the 1st quarter growing 3.4% from the 4th quarter of 2015, this gain followed two consecutive quarters of profit declines. Profits in the 1st quarter of 2016 were down 6.6% from the same 1st quarter last year. Weakness in profits is likely contributing to the recent national pullback in business spending and hiring growth.
• Second quarter corporate profit figures will be released on August 26th.
Early results are showing profit declines in the 2nd quarter.

• The Commerce Department’s July 27th report on durable goods orders (items ranging from toasters to aircraft meant to last three years or more) fell 4% in June from the prior month. Non-defense capital goods orders excluding aircraft, a closely watched proxy for business spending plans, increased a modest 0.2% in June following a 0.5% decline in May.
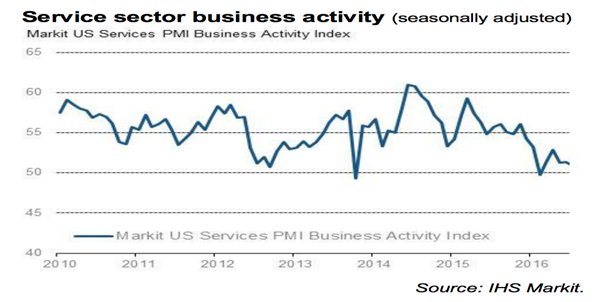
• Service-sector activity in July grew at the slowest pace in five months, according to Markit Economics' preliminary report. The flash services purchasing manager's index (PMI) for July came in at 50.9, anything above 50 indicates expansion. One encouraging sign was a rebound in business confidence following June’s survey low. This may point to a return to stronger growth in the coming quarters.
• In a Wall Street Journal survey earlier this month, economists put the
probability of a recession starting within the next year at 22%. This was at its
highest level since December 2012.
Recession Odds
Average Probability of the U.S. economy entering recession in the coming 12 months

• The past two recessions were ushered in by a collapse in asset prices. Net wealth in the U.S. now tops 500% of national income. Net wealth has reached that level only twice before: from 1999 to 2000 during the Nasdaq bubble, and 2004 to 2008 during the housing boom.
• High asset prices do not necessarily mean that those assets are overvalued, or about to crash. But it is a sign of an economy that is more vulnerable to sudden shifts in financial markets. Central banks have compounded that vulnerability by pumping up growth with low and even negative interest rates that have kept asset markets inflated.
Stock Market
• Estimated and final income tax payments account for approximately 40% of
total state income tax receipts. Both the estimated and final payments had a
negative rate of growth in Fiscal Year 2016. Stock market adjustments that
impacted Fiscal Year 2016 receipts were the strongest contributing factor in the
decline.

• The graphs below show the year-to-date movement in the DOW and the S&P
respectively at this writing. There has been significant market volatility
following the Brexit vote.

***END***