
Comptroller Kevin Lembo Archive > News
COMPTROLLER LEMBO REPORTS $315.8-MILLION DEFICIT FOR FISCAL YEAR 2016Comptroller Kevin Lembo today reported a $315.8-million deficit for Fiscal Year 2016, pending final budget accruals – but noted that while global factors have contributed to additional market volatility, there are some bright spots among Connecticut's economic indicators.
As final budget accruals continue to come in through July and August, Lembo will continue to report updates on Fiscal Year 2016 in the coming months until he releases the final unaudited number on Sept. 30 - and the final audited report by Dec. 31. In September, Lembo will begin reporting early projections for Fiscal Year 2017, which begins today.
In his letter to Gov. Dannel P. Malloy, Lembo said he agrees with the Office of Policy and Management's (OPM) latest deficit projection, which is an increase of $56.7 million from last month. The most significant single adjustment to the General Fund this month was a reduction in projected income tax payments of $75 million - largely driven by market volatility.
"Connecticut's income tax collections have been revised downward throughout this fiscal year as capital-gains-related income tax receipts were constrained by market volatility - prompted by global factors, including the Chinese markets and now 'Brexit' - and payroll-related tax gains were hampered by lower than anticipated labor market activity," Lembo said.
While revenue projections fell during the year, Lembo noted that cost-cutting measures were implemented by both the governor and legislative action – the aggregate result of these actions reducing anticipating spending by $156.6 million.
Lembo noted that the Budget Reserve Fund currently holds a balance of $406 million, which - at present, prior to accrual activities – appears sufficient to offset the General Fund shortfall.
Lembo said that, while the state economy - much like the national economy - continues to recover at a positive but slow rate, there are some recent positive signs to point to, particularly in the housing market and household spending.
“A bright spot in the state's economy has been the number of housing sales,” Lembo said, pointing to reports that single-family home sales in Connecticut grew by 16.2 percent in April from the same month last year and sales prices for those homes rose by .8 percent in April compared to a year ago. “This is the first price gain after 12 consecutive months of price drops on a year-over-year basis.”
Lembo also pointed to consumer spending data released this month showing a continuation of solid household spending. Citing the Commerce Department, Lembo said, "Nine of 13 major categories showed increases in demand in May from the prior month with gains led by gasoline stations, online retailers and hobby and entertainment stores."
Lembo pointed to some of the latest additional economic indicators from the
federal and state Departments of Labor and other sources that show:

• Through May, year-to-date income tax withholding receipts were running 3.3
percent above the same period last fiscal year. New tax rate tables
incorporating the higher rate structure as adopted in PA 15-244 were required to
be implemented by the end of August. Therefore, beginning in September 2015
receipts have incorporated the higher tax rates.
• Payroll-driven withholding receipts are the largest single source of state tax
revenue, accounting for 61 percent of the total income tax receipts in Fiscal
Year 2015 and almost 40 percent of total General Fund tax receipts in that year.
With the exception of tax increase spikes in Fiscal Years 2011 and 2012, the
current cycle of economic recovery has posted below normal withholding gains.

• The Department of Labor reported that the state lost 1,400 jobs in May
2016, falling to a level of 1,688,100. This is the second employment decline
posted to date in Fiscal Year 2016 and the first job decline of calendar year
2016. Statewide nonagricultural employment gains now tally 13,900 (0.8 percent
or 1,158 per month) since May 2015. The initial announcement of a 3,500-job gain
for April 2016 was revised down to 3,200.
• Connecticut has now recovered 93,900 positions, or 78.8 percent of the 119,100
seasonally adjusted total nonfarm jobs that were lost in the state during the
March 2008 - February 2010 employment recession. The state needs to reach the
1,713,300 seasonally adjusted job mark to enter a clear nonfarm employment
expansion. This will require 25,200 more nonfarm jobs. Connecticut's nonfarm jobs recovery
is now 75 months old and is averaging 1,252 jobs per month since February 2010.

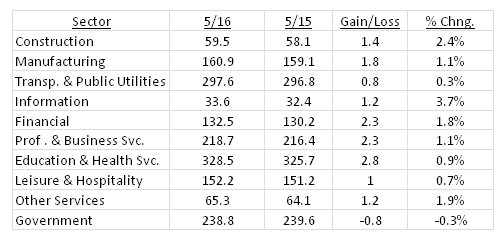
• As the state's employment recovery has progressed over the past year, an
increasing number of job sectors have posted sustained employment gains.
• U.S. employment has been advancing at a rate of 1.7 percent over the
12-month period ending in May; Connecticut's employment growth was 0.8 percent
for the same period.
• Connecticut's unemployment rate was 5.7 percent in May; the national
unemployment rate was 4.7 percent. Connecticut's unemployment rate has continued
to decline from a high of 9.5 percent in October 2010.
• There were 108,300 unemployed job seekers in Connecticut in April. A low of
36,500 unemployed workers was recorded in October of 2000. The number of
unemployed workers hit a recessionary high of 177,200 in December of 2010.
![]()
• The private-sector workweek, not seasonally adjusted, averaged 34.0 hours in
May 2016, up seven-tenths of an hour from the same month a year ago. Average
hourly earnings at $30.66, not seasonally adjusted, were up $1.98, or 6.9
percent, from the May 2015 hourly earnings estimate ($28.68). The resultant
average weekly pay was calculated at $1,042.44, up $87.40, or 9.2 percent higher
than a year ago. The Labor Department notes that other data sources do not
support this aggressive level of wage growth. Nationally, average hourly and
weekly pay have been rising at a rate of about 2 percent.
• The 12-month percent change in the Consumer Price Index for All Urban
Consumers (CPI-U, U.S. City Average, not seasonally adjusted) in May 2016 was an
even 1 percent.
• Connecticut ranked 36th nationally in income growth for the 1st quarter of
2016 based on personal income statistics released by the Bureau of Economic
Analysis on June 22. The state's personal income was growing at an annualized
3.1-percent rate in the 1st quarter of the year. This is the same growth level
recorded in 2015.

• Personal income statistics for 2nd quarter personal income growth will be released on Sept. 28.

• According to a June 7 release by the Warren Group, single family home sales in
Connecticut grew by 16.2 percent in April from the same month last year.
Connecticut recorded 2,340 single-family home sales in April 2016, the most
sales in the month of April since 2007. Condominium sales were also up growing
18.7 percent from last April with 659 new purchases.
• Single-family home prices in Connecticut continued to be soft. The sales price
rose by 0.8 percent in April to $240,000 compared to $238,200 a year ago. This
is the first price gain after 12 consecutive months of price drops on a
year-over-year basis. Condominium prices continued to fall in April from
$163,450 to $157,000, a 3.9-percent drop from last April.
• Inventory for single family homes in Connecticut was nine months for the 1st
quarter of 2016, up from 7.9 months in the same quarter last year. Inventory for
condominiums was 8.5 months, up slightly from 8.1 months in First Quarter 2015.
This number tells you how many months it would take for all the current homes on
the market to sell, given the monthly sales volume. Four to five months of
supply is average. As the number rises it indicates that there are more sellers
than buyers, or a buyer's market.

Consumers
• Consumer spending data released this month has pointed to a continuation of solid household spending. The Commerce Department reported that May retail sales advanced 0.5 percent over April. Nine of 13 major categories showed increases in demand in May from the prior month. Gains were led by gasoline stations, on-line retailers and hobby and entertainment stores. Department stores and building supply and gardening stores posted declines. Sales for April were unrevised at a 1.3-percent gain, the strongest advance since March 2015.

• The core sales number, which exclude categories such as food services, auto
dealers, home-improvement stores and service stations, increased 0.4 percent in
May after rising 1 percent in April. This is the strongest gain in core sales in
two years.
• Retail sales aren't the only determinant of overall consumer spending in the
U.S. The Commerce Department's Quarterly Estimates for Selected Service
Industries documents consumer spending on utilities, transportation, education,
administrative support and professional services, among other expenditures that
aren't captured in the retail sales report. The 1st quarter of 2016 posted a
total revenue gain of 3.6 percent over the same quarter last year. The
quarter-to-quarter change was down slightly, but the longer-term trend has shown
quarterly gains for the past several years.
• The Conference Board's consumer confidence index rose 6.1 percent from the
same period last month. This follows two consecutive months of a decline in the
index. The June reading was at its highest level since October. The cutoff
period for the survey was June 16, which was ahead of the British vote on
leaving the EU. The index was likely boosted by the stabilization in gas prices
as well as generally positive trends in the jobs market. Consumers were
"cautiously optimistic" about economic growth in the short term. The numbers are
consistent with a continued increase in consumer spending.
• The Federal Reserve's June report on consumer borrowing showed 4.5 percent
annualized growth in consumer credit in April. This follows a strong gain of 9.5
percent in March. The use of revolving credit, mostly credit cards, rose 2.1
percent. Non-revolving credit, which includes student loans, increased 5.4
percent. The percentage of Americans with subprime credit scores has fallen to
the lowest level in more than a decade according to FICO, development that could
give bank lending and the overall economy a boost.
• The graph below shows the general upward trend in consumer borrowing since the
end of the recession. The March number was a post-recession high.

Business and Economic Growth
• According to the June 28 third estimate by the Bureau of Economic Analysis,
GDP in the 1st quarter of 2016 grew at a 1.1-percent annual rate. This is an
upward revision from the 0.8 percent second estimate. In the 4th quarter GDP
expanded by 1.4 percent.
• The deceleration in real GDP between the 4th quarter and the 1st quarter
reflected a slowdown in personal consumption expenditures, a larger decrease in
nonresidential fixed investment, and a downturn in federal government spending.
These slower spending trends were partly offset by upturns in state and local
government spending, exports and residential fixed investment.
• The Atlanta Federal Reserve is currently estimating that 2nd-quarter GDP will
rise at a 2.6-percent rate.
• Corporate profits were positive in the 1st quarter, growing 1.8 percent. This
followed two consecutive quarters of profit declines. Profits in the 1st quarter
of 2016 were down 4.3 percent from the same quarter last year. Weakness in
profits is likely contributing to the recent national pullback in business
spending and hiring growth. Overall business spending sliced off 0.58 percent
from 1st quarter GDP. Business spending has contracted for two consecutive
quarters.
• The Commerce Department's June 24 report on durable goods orders (items
ranging from toasters to aircraft meant to last three years or more) fell 2.2
percent in May from April.
• The May report was led by a 34-percent drop in military-aircraft orders.
However, orders in May were down in nearly every category. Excluding
transportation, orders were down 0.3 percent. Excluding defense spending, orders
were down 0.9 percent.
• The service sector of the economy delivered flat results in June. The
seasonally adjusted Markit Flash U.S. Services PMI Business Activity Index
registered 51.3 in June, unchanged from the May reading. This is slightly above
the neutral reading of 50. The 2nd quarter's average reading was just slightly
firmer than the one seen in the 1st quarter.
• Service providers indicated another drop in confidence regarding the
year-ahead business outlook, with the latest reading the weakest since the
survey began in late 2009. The index has been on a downward slope since 2015.

• In a Wall Street Journal survey earlier this month, economists put the
probability of a recession starting within the next year at 21 percent, up from
just 10 percent a year earlier.
Stock Market
• Estimated and final income tax payments account for approximately 40 percent of total state income tax receipts. At the end of April, year-to-date estimated and final income tax payments for Fiscal Year 2016 were running $83 million lower in actual receipts than last fiscal year. Stock market adjustments that impacted Fiscal Year 2016 receipts were the strongest contributing factor in the decline.

• The graphs below show the year-to-date movement in the DOW and the S&P respectively at this writing. There has been significant market volatility following the Brexit vote.

***END***